Mastering Power BI - Data Modelling & DAX


- Description
- Curriculum
- Reviews
Data has become one of the most valuable assets for modern organizations, and the ability to transform raw data into actionable insights is a highly sought-after skill. Mastering Power BI – Data Modelling & DAX is a comprehensive course designed to help learners develop the practical knowledge required to build efficient data models, prepare high-quality datasets, and create powerful analytical solutions using Microsoft Power BI.
The course begins with an introduction to Power BI and its role in modern business intelligence. Learners will explore how organizations use Power BI to analyze data, monitor key performance indicators, and support data-driven decision-making. The course also introduces the Power BI environment, including data source connectivity, the Data Model interface, and the Query Editor, providing a strong foundation for working with business data.
A significant portion of the course focuses on data preparation using Power Query Editor. Learners will gain hands-on knowledge of data cleaning techniques, including analyzing data quality, managing rows and columns, applying transformations, and restructuring datasets using Pivot and Unpivot operations. These skills are essential for converting raw, unorganized data into structured datasets ready for analysis and reporting.
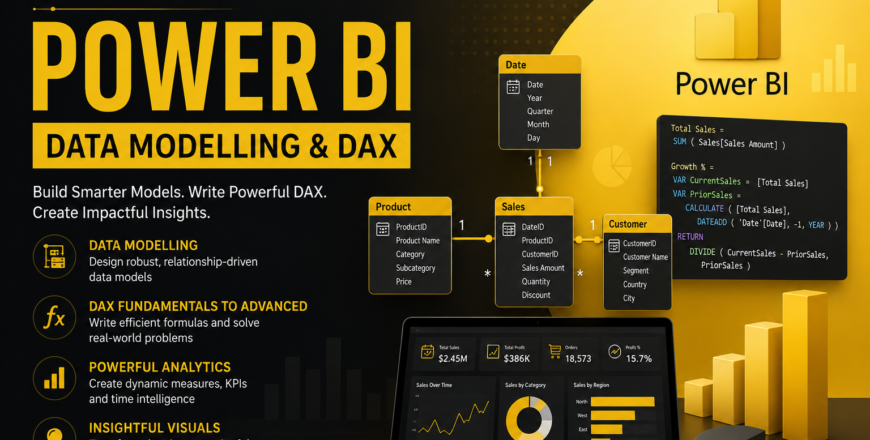
The course then dives deep into data modeling concepts, teaching learners how to create effective relationships between tables and design scalable data architectures. Topics such as Fact and Dimension tables, star schema design, relationship management, cardinality types, and filter directions are covered in detail. Learners will understand how properly designed data models improve report accuracy, performance, and maintainability.
In addition, the course introduces two critical languages used in Power BI development: M Language and DAX (Data Analysis Expressions). Learners will understand how M Language powers data transformation processes within Power Query, while DAX enables the creation of advanced calculations, measures, and business metrics. These skills allow users to move beyond basic reporting and build dynamic, interactive analytical solutions.
Throughout the course, learners will develop a strong understanding of how data flows from source systems into Power BI, how it is transformed and modeled, and how advanced calculations can be used to generate meaningful business insights. The practical focus ensures that learners gain real-world skills applicable to business intelligence, reporting, analytics, and dashboard development projects.
Whether you are a business analyst, data analyst, reporting professional, or someone looking to start a career in business intelligence, this course provides the essential knowledge needed to work confidently with Power BI’s data preparation, modeling, and analytical capabilities.
What You Will Learn
- Understand the Power BI ecosystem and business intelligence concepts
- Connect Power BI to multiple data sources
- Use Power Query Editor for data cleaning and preparation
- Analyze and improve data quality
- Apply row and column transformations
- Use Pivot and Unpivot operations effectively
- Create Fact and Dimension tables
- Design efficient star schema data models
- Build and manage table relationships
- Understand cardinality types and filter directions
- Optimize Power BI data models for performance
- Learn the fundamentals of M Language
- Create calculations using DAX
- Build measures, calculated columns, and calculated tables
- Develop scalable and efficient business intelligence solutions
Key Topics Covered
Power BI Fundamentals
- Introduction to Power BI
- Business Intelligence concepts
- Data source connectivity
- Power BI interface and tools
Data Preparation with Power Query
- Data quality assessment
- Row and column management
- Data transformation techniques
- Pivot and Unpivot operations
- Query Editor fundamentals
Data Modeling
- Relationships and relationship management
- Fact and Dimension tables
- Star schema design
- Cardinality types
- Filter directions
- Model optimization techniques
Advanced Power BI Development
- Introduction to M Language
- Data transformation scripting
- DAX fundamentals
- Measures and calculated columns
- Business calculations and analytics
Who Should Take This Course?
This course is ideal for:
- Aspiring Data Analysts
- Business Intelligence Professionals
- Power BI Beginners
- Reporting and Dashboard Developers
- Business Analysts
- Data Professionals looking to improve modeling skills
- Students interested in data analytics and visualization
Basic knowledge of Excel and data concepts is helpful but not mandatory.
Learning Outcomes
By the end of this course, learners will be able to:
- Import and prepare data from multiple sources
- Clean and transform datasets using Power Query
- Build efficient and scalable data models
- Create and manage relationships between tables
- Understand and apply dimensional modeling concepts
- Optimize Power BI models for better performance
- Write and understand basic M Language scripts
- Create powerful DAX measures and calculations
- Develop interactive reports and analytical dashboards
- Apply Power BI best practices in real-world business scenarios
Final Outcome
Upon completing this course, learners will possess the practical skills required to prepare, model, and analyze data using Power BI. They will be able to build professional-grade data models, create meaningful business calculations with DAX, optimize report performance, and develop data-driven solutions that support effective decision-making in modern organizations. This course provides a strong foundation for advanced Power BI development and a successful career in business intelligence and analytics.
-
1
 1. What is Power BI
This lesson introduces Power BI, Microsoft's powerful business intelligence and data visualization platform. Learners will understand its key features, capabilities, and role in transforming raw data into meaningful business insights.
-
2
2. How is it used in Business
This lesson explores how businesses use Power BI to analyze data, monitor performance, and support strategic decision-making through interactive reports and dashboards.
-
3
3. Introduction to Connecting to Data Sources
This lesson introduces the process of connecting Power BI to various data sources, enabling users to import, access, and analyze data from multiple platforms.
-
4
4. Introduction to Data Model User Interface Options
This lesson provides an overview of the Power BI Data Model interface and explains how users can manage relationships, tables, and model structures effectively.
-
5
5. Introduction to Query Editor
This lesson introduces Power Query Editor, the data transformation tool within Power BI used for cleaning, shaping, and preparing data before analysis.
-
6
 6. Quiz
-
7
1. Analyzing the Data Quality
This lesson introduces the process of evaluating data quality within Power Query Editor. Learners will explore techniques for identifying errors, missing values, duplicates, and inconsistencies to ensure that datasets are reliable and ready for analysis.
-
8
2. Keep and Remove Rows
This lesson explains how to refine datasets by keeping relevant records and removing unnecessary rows, helping create cleaner and more focused datasets for reporting and analysis.
-
9
3. Removing and Choosing Column
This lesson focuses on selecting useful columns and removing unnecessary fields to optimize datasets and simplify the reporting process.
-
10
4. Column Transformations
This lesson introduces various column transformation techniques used to clean, standardize, and restructure data for more effective reporting and analysis.
-
11
5. Pivot and Unpivot
This lesson explores Pivot and Unpivot operations, which allow learners to restructure datasets into formats that are more suitable for analysis, visualization, and data modeling.
-
12
6. Quiz
-
13
1. Understanding Definition of Relationships
This lesson introduces the concept of relationships in Power BI and explains how tables can be connected to create a unified data model for accurate reporting and analysis.
-
14
2. Creating Dim and Fact Table
This lesson focuses on the creation of Dimension and Fact tables, the core building blocks of a well-structured Power BI data model used in business reporting and analytics.
-
15
3. Data Model Relationship and Optimization
This lesson explores techniques for managing relationships and optimizing Power BI data models to improve report performance, scalability, and analytical accuracy.
-
16
4. Quiz
-
17
5. Cardinality Types
This lesson explains the different cardinality types used in Power BI relationships and how they influence data modeling, filtering behavior, and report accuracy.
-
18
6. Filter Directions
This lesson introduces filter directions in Power BI and explains how data flows between related tables to influence calculations, reports, and visualizations.
-
19
7. M –Language
This lesson introduces M Language, the scripting language behind Power Query, and explains how it is used to automate and customize data transformation processes in Power BI.
-
20
8. DAX
This lesson introduces DAX (Data Analysis Expressions), the formula language used in Power BI for creating calculations, measures, and advanced analytical logic.
-
21
9. Quiz